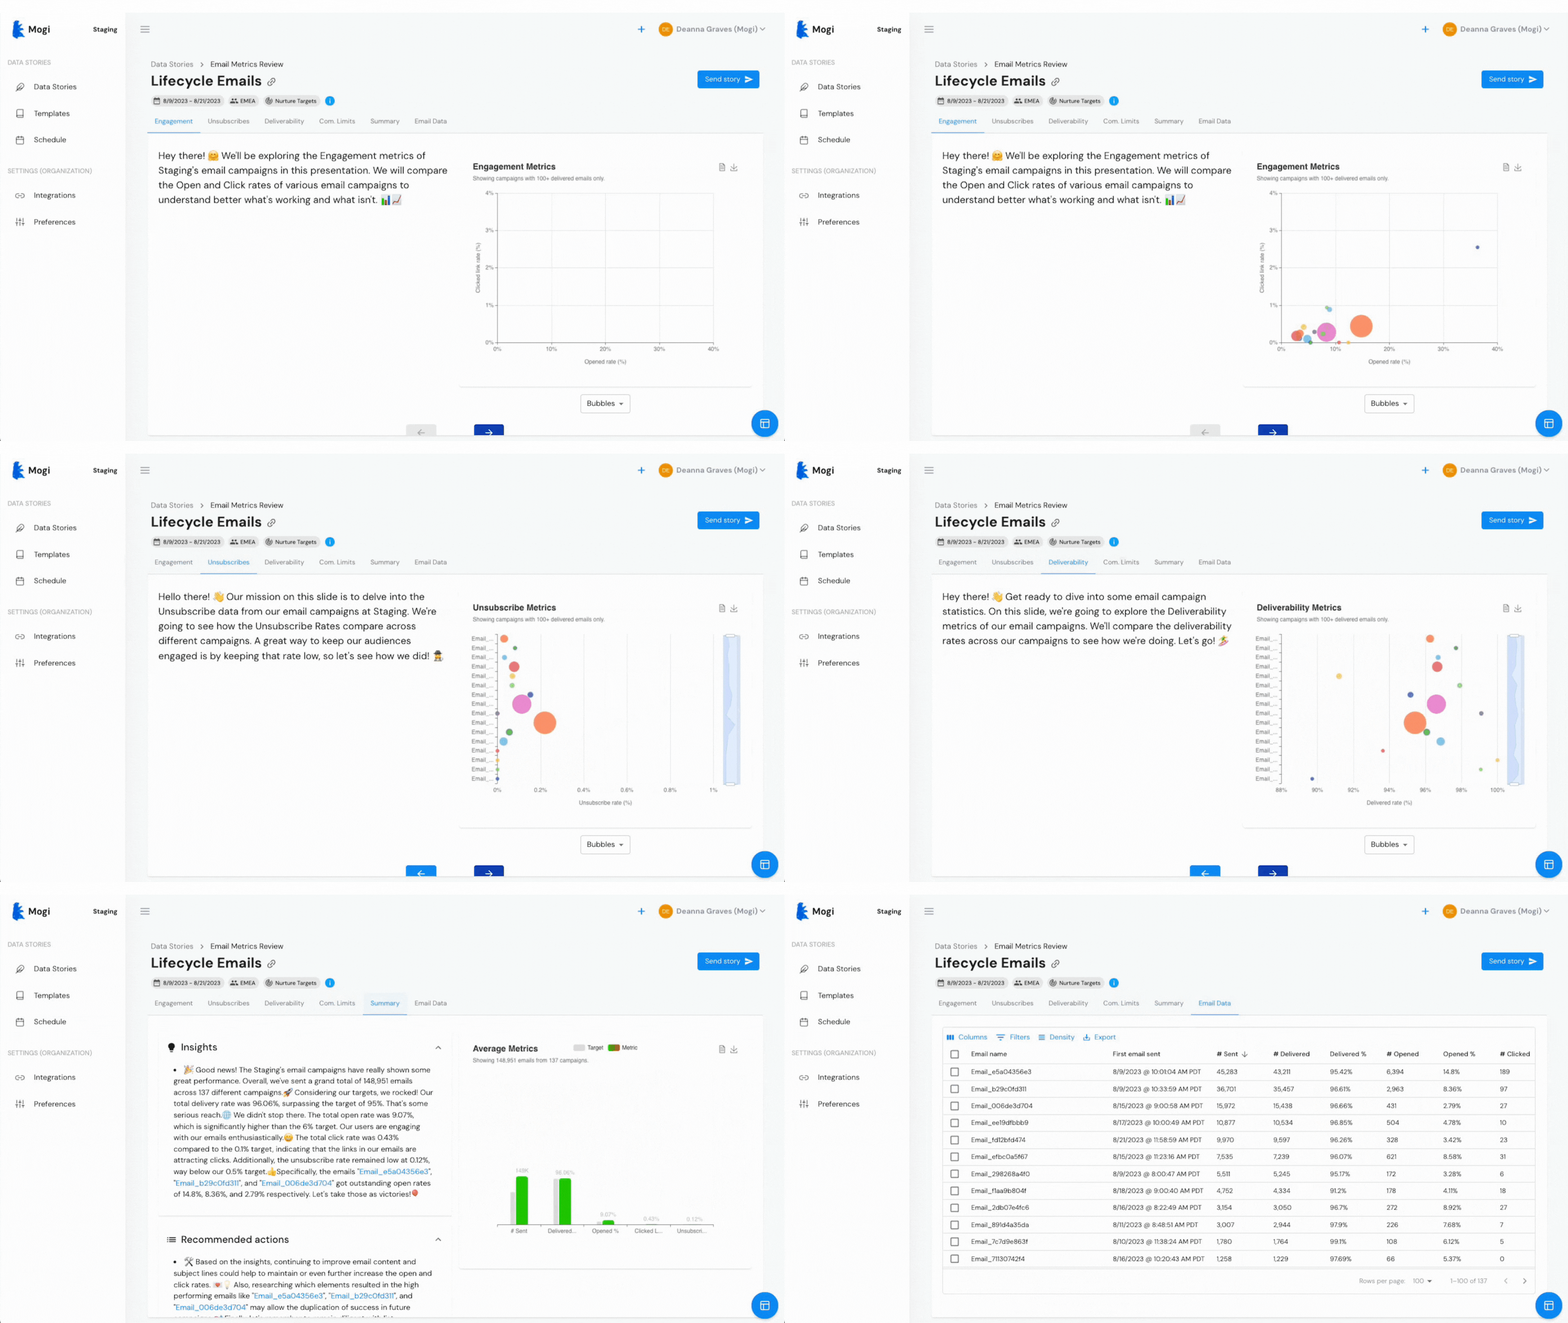
Consolidate your analysis and insights into one streamlined, centralized hub.

Integrations
Seamlessly connect your existing dashboards from business intelligence (BI) platforms or spreadsheets.
AI-Driven Insights
Automatically surface critical trends, anomalies, and actionable insights using advanced AI technology. Set, track, and report on pacing towards goals.
Prompt Builder
Use our interactive analysis prompt builder to craft custom narratives from a single or multiple data sources, highlighting the most relevant insights for each team.
Multi-Channel Distribution
Share these stories across your organization via email, Slack, or other communication tools, and deliver context-specific formats like slide decks and email summaries.

Bring the data to life with animated visuals.
Mogi goes beyond static charts and graphs.
Our animated visuals add dynamism to data, making trends and insights not only more engaging but also easier to understand. This lively representation ensures that your data doesn't just inform, but also captivates and motivates action.
Evaluate business performance against goals and expectations.
With Mogi, you're not just analyzing data - you're measuring success.
By comparing actual performance to set benchmarks, you can clearly see where you're excelling and where there's room for improvement. This feature helps ensure that your strategies are aligned with your objectives and facilitates proactive adjustments for optimized outcomes.


Offer actionable business insights and recommendations.
Mogi doesn't just present data; it translates it into clear, actionable steps.
Our platform pinpoints areas of opportunity and provides concrete recommendations, ensuring that you're not only informed but also equipped to act, optimizing your strategies for better results.
Turning data into action for the following customers


